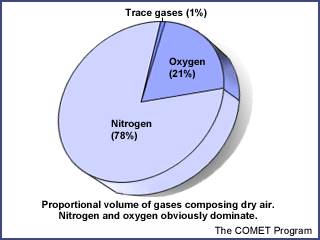
The thin envelope of air that
surrounds our planet is a mixture of gases, each with its own physical
properties. The mixture is far from evenly divided. Two elements, nitrogen and
oxygen, make up 99% of the volume of air. The other 1% is composed of "trace"
gases, the most prevalent of which is the inert gaseous element argon. The rest
of the trace gases, although present in only minute amounts, are very important
to life on earth. Two in particular, carbon dioxide and ozone, can have a large
impact on atmospheric processes.
Another gas, water vapour, also
exists in small amounts. It varies in concentration from being almost
non-existent over desert regions to about 4% over the oceans. Water vapour is
important to weather production since it exists in gaseous, liquid, and solid
phases and absorbs radiant energy from the earth.
Structure of the Atmosphere
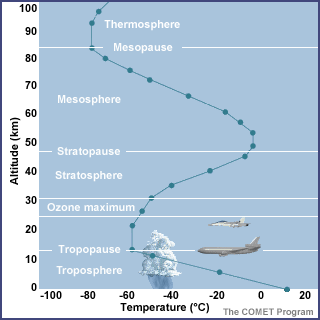
The atmosphere is divided
vertically into four layers based on temperature: the troposphere,
stratosphere, mesosphere, and thermosphere. Throughout the
Cycles unit, we'll focus primarily on the layer in which we live - the
troposphere.
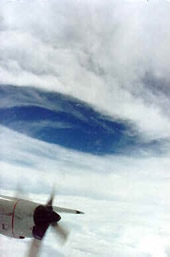
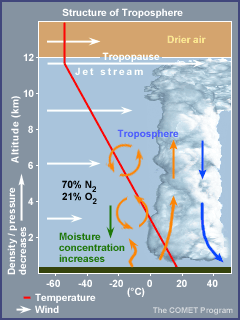
Troposphere
The word troposphere comes from
tropein, meaning to turn or change. All of the earth's weather occurs in
the troposphere.
The troposphere has the
following characteristics.
-
It extends from the earth's
surface to an average of 12 km (7 miles).
-
The pressure ranges from 1000
to 200 millibars (29.92 in. to 5.92 in.).
-
The temperature generally
decreases with increasing height up to the tropopause (top of the
troposphere); this is near 200 millibars or 36,000 ft.
-
The temperature averages
15°C (59°F) near the surface and -57°C (-71°F) at the tropopause.
-
The layer ends at the point
where temperature no longer varies with height. This area, known as the
tropopause, marks the transition to the stratosphere.
-
Winds increase with height up
to the jet stream.
-
The moisture concentration
decreases with height up to the tropopause.
-
The air is much drier above
the tropopause, in the stratosphere.
-
The sun's heat that warms
the earth's surface is transported upwards largely by convection and is
mixed by updrafts and downdrafts.
-
The troposphere is 70%
 and 21%
 . The lower density of molecules higher
up would not give us enough
to survive.
. The lower density of molecules higher
up would not give us enough
to survive.
Atmospheric Processes
Interactions - Atmosphere and Ocean
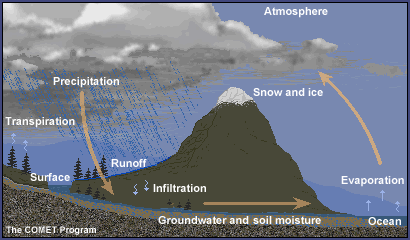
In the Cycles overview, we learned that water is
an essential part of the earth's system. The oceans cover nearly three-quarters
of the earth's surface and play an important role in exchanging and transporting
heat and moisture in the atmosphere.
- Most of the water vapour in the atmosphere
comes from the oceans.
- Most of the precipitation falling over land
finds its way back to oceans.
- About two-thirds returns to the atmosphere
via the water cycle.
You may have figured out by now that the oceans
and atmosphere interact extensively. Oceans not only act as an abundant moisture
source for the atmosphere but also as a heat source and sink (storage).
The exchange of heat and moisture has profound
effects on atmospheric processes near and over the oceans. Ocean currents
play a significant role in transferring this heat poleward. Major currents, such
as the northward flowing Gulf Stream, transport tremendous amounts of heat
poleward and contribute to the development of many types of weather phenomena.
They also warm the climate of nearby locations. Conversely, cold southward
flowing currents, such as the California current, cool the climate of nearby
locations.
Energy Heat Transfer
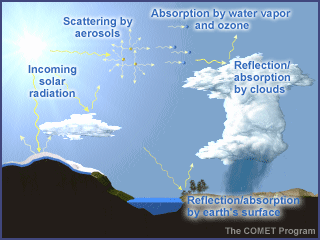
Practically all of the energy that
reaches the earth comes from the sun. Intercepted first by the atmosphere, a
small part is directly absorbed, particularly by certain gases such as ozone and
water vapor. Some energy is also reflected back to space by clouds and the
earth's surface.
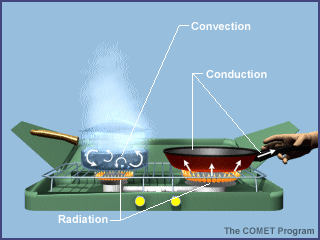
Energy is transferred between the earth's surface and the atmosphere via
conduction, convection, and radiation.
Conduction
is the process by which heat energy is transmitted
through contact with neighbouring molecules.
Some solids, such as metals, are
good conductors of heat while others, such as wood, are poor conductors. Air and
water are relatively poor conductors.
Since air is a poor conductor,
most energy transfer by conduction occurs right at the earth's surface. At
night, the ground cools and the cold ground conducts heat away from the adjacent
air. During the day, solar radiation heats the ground, which heats the air next
to it by conduction.
Convection
transmits heat by transporting groups of molecules
from place to place within a substance. Convection occurs in fluids such as
water and air, which move freely.
In the atmosphere, convection
includes large- and small-scale rising and sinking of air masses and smaller air
parcels. These vertical motions effectively distribute heat and moisture
throughout the atmospheric column and contribute to cloud and storm development
(where rising motion occurs) and dissipation (where sinking motion occurs).
To understand the convection
cells that distribute heat over the whole earth, let's consider a simplified,
smooth earth with no land/sea interactions and a slow rotation. Under these
conditions, the equator is warmed by the sun more than the poles. The warm,
light air at the equator rises and spreads northward and southward, and the cool
dense air at the poles sinks and spreads toward the equator. As a result, two
convection cells are formed.
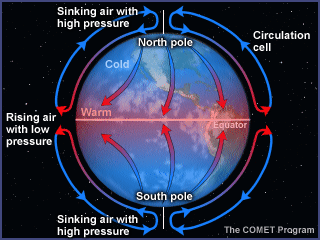
Meanwhile, the slow rotation of
the earth toward the east causes the air to be deflected toward the right in the
northern hemisphere and toward the left in the southern hemisphere. This
deflection of the wind by the earth's rotation is known as the Coriolis
effect.
Radiation
is the transfer of heat energy without the involvement of a physical substance
in the transmission. Radiation can transmit heat through a vacuum.
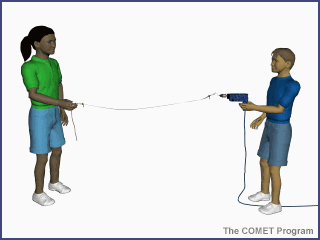
Energy travels from the sun to
the earth by means of electromagnetic waves. The shorter the wavelength, the
higher the energy associated with it. This is demonstrated in the animation
below. As the drill's revolutions per minute (RPMs) increase, the number of
waves generated on the string increases, as does the oscillation rate. The same
principle applies to electromagnetic waves from the sun, where shorter
wavelength radiation has higher energy than longer wavelength radiation.
Most of the sun's radiant energy is concentrated in the visible and near-visible
portions of the spectrum. Shorter-than-visible wavelengths account for a small
percentage of the total but are extremely important because they have much
higher energy. These are known as ultraviolet wavelengths.
Atmospheric oxygen
In the homosphere each gas
exerts a partial pressure, the product of the total atmospheric pressure and the
concentration of the gas. Thus as oxygen represents about 21% of the composite
gases, the partial pressure of oxygen is about 21% of the atmospheric pressure
at any altitude within the homosphere.
Interpolating from the pressure
gradient graph above, oxygen partial pressure at selected altitudes is shown
below. The decreasing partial pressure of oxygen as an aircraft climbs past 10
000 – 12 000 feet has critical effects on aircrew; the maximum exposure time for
a fit person, without inspiring supplemental oxygen, is shown in the right hand
column. Exposure beyond these times leads to unconsciousness.
| Altitude |
O² pressure |
Max. exposure |
| Sea level |
210 hPa |
— |
| 7000 feet |
165 hPa |
— |
| 10 000 feet |
150 hPa |
— |
| 15 000 feet |
120 hPa |
30+ minutes |
| 18 000 feet |
105 hPa |
20–30 minutes |
| 25 000 feet |
80 hPa |
3–5 minutes |
| 30 000 feet |
65 hPa |
1–3 minutes |
| 35 000 feet |
50 hPa |
30–60 seconds |
| 40 000 feet |
30 hPa |
10–20 seconds |
The average density of dry air
in temperate climates is about 1.225 kg/m³ at mean sea level, decreasing with
altitude.
There are several gas laws and equations which relate the temperature, pressure,
density and volume of a gas. However the equation most pertinent to aeronautical
needs is the equation of state:
r = P/RT where:
r (the Greek letter rho) = density in kg/m³
P = the static air pressure in hectopascals
R = the gas constant = 2.87
T = the temperature in Kelvin units = °C + 273
We can calculate the ISA
standard sea level air density, knowing that standard sea level pressure = 1013
hPa and temperature = 15 °C or 288 K
i.e. Air density = 1013 / (2.87 × 288) = 1.225 kg/m³
However if the air temperature happened to be 30 °C or 303 K at the same
pressure then density would = 1013 / (2.87 × 303) = 1.165 kg/m³ or a 5%
reduction.
By restating the equation of state: P = RrT it can be seen that if
density remains constant, pressure increases if temperature increases.
The ICAO International Standard Atmosphere
The International Civil Aviation
Organisation's International Standard Atmosphere [ ISA ] provides a fixed
standard atmospheric model used for many purposes among which are the uniform
assessment of aircraft performance and the calibration of some aircraft
instruments. The model is akin to the average condition in mid-latitudes but
contains the following assumptions:
- dry air is assumed throughout the atmosphere
- the mean sea level pressure = 1013.25 hPa
- the msl temperature = 15 °C [288 K]
- the tropopause is at 36 090 feet [11 km] and
the pressure at the tropopause = 226.3 hPa
- the temperature lapse rate to 36 090 feet =
6.5 °C per km or nearly 2 °C per 1000 feet
- the temperature between 36 090 and 65 600
feet [20 km] remains constant at –56.5 °C.
The table below shows a few values derived from
the ISA. Those pressure levels noted with a flight level designator are standard
pressure levels used for aviation weather purposes, particularly thickness
charts.
| Pressure |
Flight
level |
Temperature |
Air
density |
Altitude |
| hPa |
|
°C |
kg/m³ |
feet |
| 1013 |
|
15 |
1.225 |
msl |
| 1000 |
|
14.3 |
1.212 |
364 |
| 950 |
|
11.5 |
1.163 |
1773 |
| 900 |
|
8.6 |
1.113 |
3243 |
| 850 |
A050 |
5.5 |
1.063 |
4781 |
| 800 |
|
2.3 |
1.012 |
6394 |
| 750 |
|
-1.0 |
0.960 |
8091 |
| 700 |
A100 |
-4.6 |
0.908 |
9882 |
| 650 |
|
-8.3 |
0.855 |
11 780 |
| 600 |
FL140 |
-12.3 |
0.802 |
13 801 |
| 550 |
|
-16.6 |
0.747 |
15 962 |
| 500 |
FL185 |
-21.2 |
0.692 |
18 289 |
| 450 |
|
-26.2 |
0.635 |
20 812 |
| 400 |
FL235 |
-31.7 |
0.577 |
23 574 |
| 350 |
|
-37.7 |
0.518 |
26 631 |
| 300 |
FL300 |
-44.5 |
0.457 |
30 065 |
| 250 |
FL340 |
-52.3 |
0.395 |
33 999 |
| 200 |
FL385 |
-56.5 |
0.322 |
38 662 |
| 150 |
FL445 |
-56.5 |
0.241 |
44 647 |
| 100 |
|
-56.5 |
0.161 |
53 083 |
Not immediately apparent from the ISA table
is that the pressure lapse rate is about one hPa per 30 feet up to the 850 hPa
level, then slowing to 40 feet per hPa at the 650 hPa level, 50 feet at the 450
hPa level, 75 feet at the 300 hPa level and so on, however, this provides a
useful rule of thumb:
Rule of Thumb #1
"An altitude change of 30 feet per hPa can be assumed for operations below
10 000 feet."
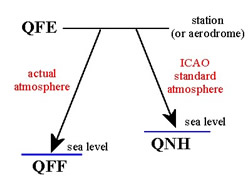
station pressure, sea level
pressure and altimeter setting
Station
pressure is the actual
atmospheric pressure at the elevation of the observing station.
QFE: The
pressure corrected to the official airfield elevation. An altimeter set to the
particular airfield QFE reads zero when an aircraft is on the ground (strictly
the height of the altimeter above the ground). In the circuit, the height
indicated is the height above official airfield datum.
QNH: The pressure
'reduced' to mean sea level, assuming ISA temperature profile from the
station/airfield to MSL. An altimeter set to the airfield QNH reads the
elevation of the airfield when on the ground.
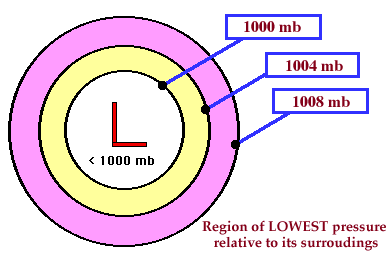
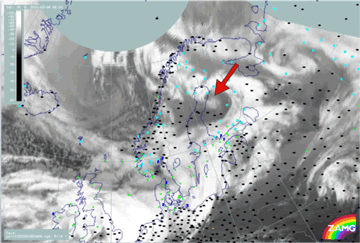
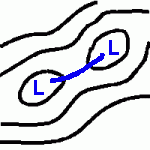
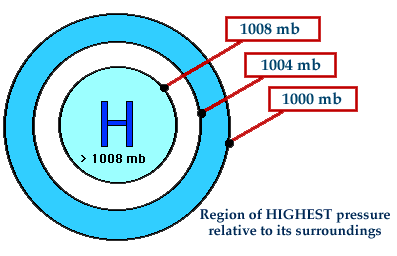
pressure systems
The pressure chart shows the
distribution of atmospheric pressure. Pressure systems - depressions (LOW
pressure regions) and anticyclones (HIGH pressure) are marked and Isobars
are drawn on the chart to link areas with the same pressure. Isobar lines are
drawn at 4mB interval (4 HPa) and weather frontal systems are marked using
standard symbols.