|
On 21 Feb 2002, a surface
low-pressure system existed in the Great Lakes region. Aircraft icing
conditions accompanied the storm in widespread stratus clouds behind a cold
front. A series of graphics created from CIP data at 1400 UTC is shown on
the right. The thumbnail graphics show the Great Lakes region of the U.S.
whereas clicking on the graphic reveals coverage for the entire CIP domain
along with PIREPs of icing overlaid from this particular event.
Note the yellow, orange, and red colours found in northern Ohio and
Indiana. These colours denote the highest potential for icing whereas the
"cooler" hues of green and blue denote a lower icing potential (see the full
graphic for the scale). It is worth repeating here: the icing potential
scale conveys the potential or likelihood for icing but is not an absolute
probability scale from a statistical standpoint. No information is provided
as to the severity of icing and none should be inferred. Future versions of
this product will predict severity. On this day, the graphics show the
greatest icing potential at flight levels 030, 060, and 090 while the
potential rapidly decreases above FL120 because the top of the clouds is
found near FL120. (Graphics above FL120 omitted.)
For a single quick overview of icing threat, you can view the graphic
labelled Composite.
This composite graphic displays the maximum icing potential at any vertical
level (FL001 to FL300) and provides a quick mechanism to see if icing exists
in a given location before proceeding to locate the icing potential
vertically. Besides clicking on subsequent individual levels, locating the
vertical extent of icing threat is aided by the
bases and
tops
graphics. A threshold minimum value of 15 is used to locate
the base and top at every grid point displayed. In other words, the lowest
flight level with a CIP value greater than or equal to 15 is displayed as
the "base" while the highest flight level with CIP value greater than or
equal to 15 qualifies as "top." Keep in mind the graphics displayed here are
from an event in the past. Utilize the realtime ADDS
graphics of CIP from the Icing tab above for current data.
In order to gain confidence using the product, view the locations of
actual pilot reports of icing overlaid on the CIP graphics. For the event
shown here, click the thumbnail image for a larger view that also includes
the PIREPs. Negative icing PIREPs should appear primarily in regions
coloured white while positive reports should appear in coloured regions with
a majority of PIREPs appearing in the warmer hues (yellow, orange, red). The
PIREPs are plotted within 1500 vertical feet of the advertised level and
within the past 75 minutes since issuance of the icing product. So, in the
example here at FL090, the PIREPs displayed are between FL075 and FL105 and
between 1300 and 1415 UTC.
In the discussion above, emphasis was placed on one component of CIP,
referred to as "all" or "total" icing. Another component of CIP is the "SLD"
(Supercooled Large Drop) icing product. The final graphic found to the lower
right is a plot of the SLD icing at
FL060 for this event.
This graphic shows potential for large droplet icing in central Ohio. As
stated above, SLD icing may be particularly hazardous to some aircraft.
Regions coloured gray have icing potential as found in the "all" component
but the SLD potential is indeterminate.
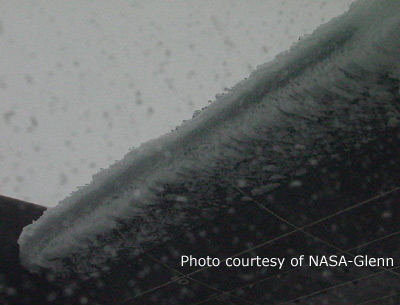
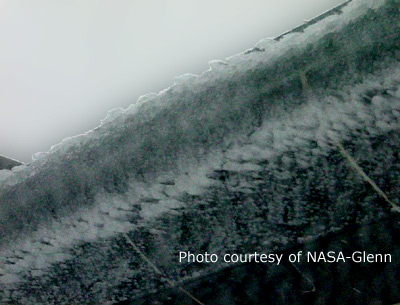
As part of the development work behind the CIP product, researchers from
NCAR and NASA purposefully fly into known icing conditions. This event was
chosen because a team of researchers flew into the clouds and icing
conditions in the area around Cleveland, OH on this day. Two photos of the
ice accretion accumulated on the NASA Glenn Research Centre Twin Otter
aircraft are shown below after flying between FL040 and FL070 south of
Cleveland. Note the large build-up of ice on the leading edge of the wing.
Photo credit: NASA Glenn Research Centre.
|
CIP graphic for FL030
CIP graphic for FL060
CIP graphic for FL090
CIP graphic for FL120

CIP composite graphic
CIP bases graphic
CIP tops graphic
CIP SLD graphic for FL060
|
