
aeronautical chartsAeronautical
charts provide important information to the pilot. Sectional charts show
topographic details, relief features and aeronautical information of the
selected area and are updated regularly. Other types of charts display routes,
airways and ground terminal locations.
The direction and distance come
from a map or chart. To navigate when driving a car one uses a map with printed
routes, and you verify your position using landmarks and signs posted along the
way. For air navigation your intended course is plotted on a map or chart and
your position is verified along the way with any number of interesting methods.
By the way, a chart is a map on which you plot a course.
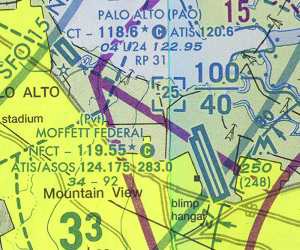
An aeronautical
chart provides pilots with a representation of a section of the Earth's surface
(hence their name "Sectional Chart"). This section shows many of the same
features on a road map. These emphasize landmarks and other special land
features that would be easy for pilots to spot from the air. It delineates
cities, tall structures, geographical features and major roads. It is also
color-coded. Yellow areas depict cities, green areas indicate hills, brown is
used to show mountains and magenta denotes roads. The intensity of the colour
corresponds to the object's height. The greater the intensity of the color, the
higher or taller the object. These charts are updated and revised every six
months. Pilots are encouraged to plot their course using the most recent and
updated chart.
The aeronautical chart is designed for convenient
navigational use by pilots. It is intended to be written on and marked up as
needed by the pilot to plot the course and/or solve navigational problems such
as calculations of direction and distance.
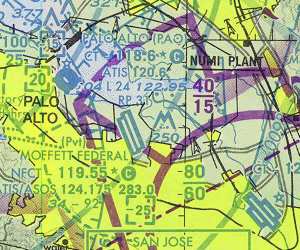
Sectional Chart
The scale of a "sectional" is 1/500,000 so one
inch is about seven nautical miles. It usually gives enough detail to fly by
ground reference or pilotage. A sectional shows highways and railroads, power
transmission lines and television and radio towers. It shows lakes, quarries,
race tracks and other landmarks. Sectionals also show information you cannot see
on the ground such as Prohibited, Restricted, Warning, and Alert Areas that have
their own special flight rules. Sectionals show Federal Airways commonly known
as Victor Airways that are highways in the sky connecting Very High Frequency
Omnirange Stations (VOR) stations. A sectional also shows topography or relief
using contour intervals and color differentiation. Blue indicates the lowest
elevations and brown indicates the highest. The highest obstruction in an area
bounded by latitude and longitudes are shown with a numeral for thousands of
feet with another numeral as a superscript for hundreds of feet. The highest
terrain elevation is shown on the front of the chart. Isogonic lines showing
Magnetic Variation are also shown on a aeronautical charts.
World Aeronautical Chart (WAC)
WAC charts scale is 1/1,000,000 making one inch about
fourteen miles. Since WAC charts cover a larger area not as much detail is
shown. WAC charts are used for flights of long distances.
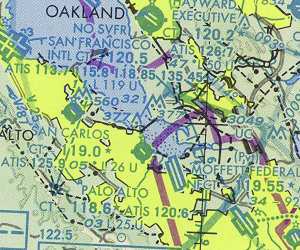
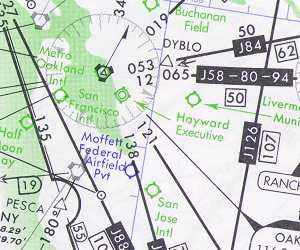
VFR Terminal Area Chart
If you plan to fly in or near a large metropolitan
area a VFR Terminal Area Chart may be available. A VFR terminal Area Chart has
everything a sectional chart has but in greater detail. The scale is 1/250,00.
Open circles with points at the top, bottom and both sides show VFR way points.
Flags indicate a visual checkpoint. An air traffic controller may tell a VFR
pilot to report over the golf course for instance. The golf course will be
indicated on sectionals and VFR Terminal Area Charts with a flag icon. Small
black squares indicate easily identified places on the ground.
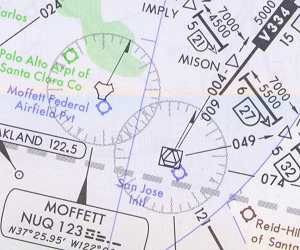
IFR Charts
If the flight will be flown under instrument
meteorological conditions, there are two types of instrument charts. Pilots also
have to file an IFR Flight Plan to fly in IMC conditions.
En Route Low Altitude Charts are used for IFR
flight planning by most propeller driven aircraft flying below the higher flying
jet aircraft. Low altitude charts show Victor Airways, minimum altitudes,
distances, magnetic courses, reporting points, and related data.
En
Route High Altitude Charts portray Jet routes, distances, time zones, special
use airspace, radar jet advisory areas, and other data. IFR flight plans are
necessary for all flights above 18,000 feet.
|
