|
Chapter 7. Safety of Flight

Section 1. Meteorology
|
7-1-16.
Reporting Prevailing Visibility
a.
Surface
(horizontal) visibility is reported in METAR
reports in terms of statute miles and increments
thereof; e.g., 1/16,
1/8, 3/16,
1/4, 5/16,
3/8, 1/2,
5/8, 3/4,
7/8, 1, 1 1/8,
etc. (Visibility reported by an unaugmented
automated site is reported differently than in a
manual report, i.e., ASOS: 0, 1/16,
1/8, 1/4,
1/2, 3/4,
1, 1 1/4, 1 1/2,
1 3/4, 2, 2 1/2,
3, 4, 5, etc., AWOS: M1/4,
1/4, 1/2,
3/4, 1, 1 1/4,
1 1/2, 1 3/4,
2, 2 1/2, 3, 4, 5,
etc.) Visibility is determined through the
ability to see and identify preselected and
prominent objects at a known distance from the
usual point of observation. Visibilities which
are determined to be less than 7 miles, identify
the obscuring atmospheric condition; e.g., fog,
haze, smoke, etc., or combinations thereof.
b.
Prevailing
visibility is the greatest visibility equalled
or exceeded throughout at least one half of the
horizon circle, not necessarily contiguous.
Segments of the horizon circle which may have a
significantly different visibility may be
reported in the remarks section of the weather
report; i.e., the southeastern quadrant of the
horizon circle may be determined to be 2 miles
in mist while the remaining quadrants are
determined to be 3 miles in mist.
c.
When the prevailing
visibility at the usual point of observation, or
at the tower level, is less than 4 miles,
certificated tower personnel will take
visibility observations in addition to those
taken at the usual point of observation. The
lower of these two values will be used as the
prevailing visibility for aircraft operations.

7-1-17.
Estimating Intensity of Rain and Ice Pellets
a. RAIN
1. Light.
From
scattered drops that, regardless of duration,
do not completely wet an exposed surface up
to a condition where individual drops
are easily seen.
2. Moderate.
Individual drops are not clearly identifiable;
spray is observable just above pavements and
other hard surfaces.
3. Heavy.
Rain
seemingly falls in sheets; individual drops
are not identifiable; heavy spray to height of
several inches is observed over hard surfaces.
b. ICE PELLETS
1. Light.
Scattered
pellets that do not completely cover an
exposed surface regardless of duration.
Visibility is not affected.
2. Moderate.
Slow
accumulation on ground. Visibility reduced by
ice pellets to less than 7 statute miles.
3. Heavy.
Rapid
accumulation on ground. Visibility reduced by
ice pellets to less than 3 statute miles.
7-1-18.
Estimating Intensity of Snow or Drizzle (Based on
Visibility)
a. Light.
Visibility more
than 1/2 statute mile.
b. Moderate.
Visibility from
more than 1/4 statute mile
to 1/2 statute mile.
c. Heavy.
Visibility
1/4 statute mile or less.
7-1-19.
Pilot Weather Reports (PIREP's)
a.
FAA air traffic
facilities are required to solicit PIREP's when
the following conditions are reported or
forecast: ceilings at or below 5,000 feet;
visibility at or below 5 miles (surface or
aloft); thunderstorms and related phenomena;
icing of light degree or greater; turbulence of
moderate degree or greater; wind shear and
reported or forecast volcanic ash clouds.
b.
Pilots are urged to
cooperate and promptly volunteer reports of
these conditions and other atmospheric data such
as: cloud bases, tops and layers; flight
visibility; precipitation; visibility
restrictions such as haze, smoke and dust; wind
at altitude; and temperature aloft.
c.
PIREP's should be
given to the ground facility with which
communications are established; i.e., EFAS, AFSS/FSS,
ARTCC, or terminal ATC. One of the primary
duties of EFAS facilities, radio call "FLIGHT
WATCH," is to serve as a collection point for
the exchange of PIREP's with en route aircraft.
d.
If pilots are not
able to make PIREP's by radio, reporting upon
landing of the inflight conditions encountered
to the nearest AFSS/FSS or Weather Forecast
Office will be helpful. Some of the uses made of
the reports are:
1.
The ATCT uses the
reports to expedite the flow of air traffic in
the vicinity of the field and for hazardous
weather avoidance procedures.
2.
The AFSS/FSS uses
the reports to brief other pilots, to provide
inflight advisories, and weather avoidance
information to en route aircraft.
3.
The ARTCC uses
the reports to expedite the flow of en route
traffic, to determine most favorable
altitudes, and to issue hazardous weather
information within the center's area.
4.
The NWS uses the
reports to verify or amend conditions
contained in aviation forecast and advisories.
In some cases, pilot reports of hazardous
conditions are the triggering mechanism for
the issuance of advisories. They also use the
reports for pilot weather briefings.
5.
The NWS, other
government organizations, the military, and
private industry groups use PIREP's for
research activities in the study of
meteorological phenomena.
6.
All air traffic
facilities and the NWS forward the reports
received from pilots into the weather
distribution system to assure the information
is made available to all pilots and other
interested parties.
TBL 7-1-5
PIREP
ELEMENT CODE CHART
| |
PIREP ELEMENT |
PIREP CODE
|
CONTENTS
|
|
1. |
3-letter
station identifier |
XXX
|
Nearest weather
reporting location to the reported
phenomenon |
|
2. |
Report type
|
UA or UUA
|
Routine or
Urgent PIREP |
|
3. |
Location
|
/OV
|
In relation to
a VOR |
|
4. |
Time
|
/TM
|
Coordinated
Universal Time |
|
5. |
Altitude
|
/FL
|
Essential for
turbulence and icing reports |
|
6. |
Type Aircraft
|
/TP
|
Essential for
turbulence and icing reports |
|
7. |
Sky cover
|
/SK
|
Cloud height
and coverage (sky clear, few, scattered,
broken, or overcast) |
|
8. |
Weather
|
/WX
|
Flight
visibility, precipitation, restrictions to
visibility, etc. |
|
9. |
Temperature
|
/TA
|
Degrees Celsius
|
|
10.
|
Wind
|
/WV
|
Direction in
degrees magnetic north and speed in knots
|
|
11.
|
Turbulence
|
/TB
|
See AIM
paragraph 7-1-21
|
|
12.
|
Icing
|
/IC
|
See AIM
paragraph 7-1-20
|
|
13.
|
Remarks
|
/RM
|
For reporting
elements not included or to clarify
previously
reported items |
e. The FAA, NWS, and other organizations
that enter PIREP's into the weather reporting
system use the format listed in TBL 7-1-5. Items
1 through 6 are included in all transmitted
PIREP's along with one or more of items 7
through 13. Although the PIREP should be as
complete and concise as possible, pilots should
not be overly concerned with strict format or
phraseology. The important thing is that the
information is relayed so other pilots may
benefit from your observation. If a portion of
the report needs clarification, the ground
station will request the information. Completed
PIREP's will be transmitted to weather circuits
as in the following examples:
EXAMPLE-
1.
KCMH UA /OV APE 230010/TM 1516/FL085/TP
BE20/SK BKN065/WX FV03SM HZ FU/TA 20/TB LGT
NOTE-
1.
One zero miles southwest of Appleton VOR;
time 1516 UTC; altitude eight thousand five
hundred; aircraft type BE200; bases of the
broken cloud layer is six thousand five hundred;
flight visibility 3 miles with haze and smoke;
air temperature 20 degrees Celsius; light
turbulence.
EXAMPLE-
2.
KCRW UV /OV KBKW 360015-KCRW/TM
1815/FL120//TP BE99/SK IMC/WX RA/TA M08 /WV
290030/TB LGT-MDT/IC LGT RIME/RM MDT MXD ICG
DURGC KROA NWBND FL080-100 1750Z
NOTE-
2.
From 15 miles north of Beckley VOR to
Charleston VOR; time 1815 UTC; altitude 12,000
feet; type aircraft, BE-99; in clouds; rain;
temperature minus 8 Celsius; wind 290 degrees
true at 30 knots; light to moderate turbulence;
light rime icing; encountered moderate mixed
icing during climb northwestbound from Roanoke,
VA, between 8,000 and 10,000 feet at 1750 UTC.
7-1-20.
PIREP's Relating to Airframe Icing
a.
The effects of ice
on aircraft are cumulative-thrust is reduced,
drag increases, lift lessens, and weight
increases. The results are an increase in stall
speed and a deterioration of aircraft
performance. In extreme cases, 2 to 3 inches of
ice can form on the leading edge of the airfoil
in less than 5 minutes. It takes but 1/2
inch of ice to reduce the lifting power of some
aircraft by 50 percent and increases the
frictional drag by an equal percentage.
b.
A pilot can expect
icing when flying in visible precipitation, such
as rain or cloud droplets, and the temperature
is between +02 and -10 degrees Celsius. When
icing is detected, a pilot should do one of two
things, particularly if the aircraft is not
equipped with deicing equipment; get out of the
area of precipitation; or go to an altitude
where the temperature is above freezing. This
"warmer" altitude may not always be a lower
altitude. Proper preflight action includes
obtaining information on the freezing level and
the above freezing levels in precipitation
areas. Report icing to ATC, and if operating IFR,
request new routing or altitude if icing will be
a hazard. Be sure to give the type of aircraft
to ATC when reporting icing. The following
describes how to report icing conditions.
1. Trace.
Ice becomes
perceptible. Rate of accumulation slightly
greater than sublimation. Deicing/anti-icing
equipment is not utilized unless encountered for
an extended period of time (over 1 hour).
2. Light.
The rate of
accumulation may create a problem if flight is
prolonged in this environment (over 1 hour).
Occasional use of deicing/anti-icing equipment
removes/prevents accumulation. It does not
present a problem if the deicing/anti-icing
equipment is used.
3. Moderate.
The
rate of accumulation is such that even short
encounters become potentially hazardous and
use of deicing/anti-icing equipment or flight
diversion is necessary.
4. Severe.
The rate of
accumulation is such that deicing/anti-icing
equipment fails to reduce or control the
hazard. Immediate flight diversion is
necessary.
EXAMPLE-
Pilot report: give aircraft identification,
location, time (UTC), intensity of type,
altitude/FL, aircraft type, indicated air
speed (IAS), and outside air temperature
(OAT).
NOTE-
1.
Rime ice. Rough, milky, opaque ice
formed by the instantaneous freezing of small
supercooled water droplets.
2. Clear ice. A glossy, clear,
or translucent ice formed by the relatively
slow freezing of large supercooled water
droplets.
3. The OAT should be requested
by the AFSS/FSS or ATC if not included in the
PIREP.
7-1-21.
PIREP's Relating to Turbulence
a.
When encountering
turbulence, pilots are urgently requested to
report such conditions to ATC as soon as
practicable. PIREP's relating to turbulence
should state:
1. Aircraft
location.
2. Time of
occurrence in UTC.
3. Turbulence
intensity.
4. Whether the
turbulence occurred in or near clouds.
5. Aircraft
altitude or flight level.
6. Type of
aircraft.
7. Duration of
turbulence.
EXAMPLE-
1.
Over Omaha, 1232Z, moderate turbulence
in clouds at Flight Level three one zero,
Boeing 707.
2. From five zero miles south of
Albuquerque to three zero miles north of
Phoenix, 1250Z, occasional moderate chop at
Flight Level three three zero, DC8.
b.
Duration and
classification of intensity should be made using
TBL 7-1-6.
TBL 7-1-6
Turbulence Reporting Criteria Table
|
Intensity
|
Aircraft
Reaction
|
Reaction Inside
Aircraft
|
Reporting
Term-Definition
|
|
Light
|
Turbulence that
momentarily causes slight, erratic changes
in altitude and/or attitude (pitch, roll,
yaw). Report as Light Turbulence;
1
or
Turbulence that
causes slight, rapid and somewhat rhythmic
bumpiness without appreciable changes in
altitude or attitude. Report as Light
Chop. |
Occupants may
feel a slight strain against seat belts or
shoulder straps. Unsecured objects may be
displaced slightly. Food service may be
conducted and little or no difficulty is
encountered in walking. |
Occasional-Less
than 1/3 of the time.
Intermittent-1/3
to 2/3.
Continuous-More
than 2/3. |
|
Moderate
|
Turbulence that
is similar to Light Turbulence but of
greater intensity. Changes in altitude
and/or attitude occur but the aircraft
remains in positive control at all times. It
usually causes variations in indicated
airspeed. Report as Moderate Turbulence;
1
or
Turbulence that is similar to Light Chop but
of greater intensity. It causes rapid bumps
or jolts without appreciable changes in
aircraft altitude or attitude. Report as
Moderate Chop. 1
|
Occupants feel
definite strains against seat belts or
shoulder straps. Unsecured objects are
dislodged. Food service and walking are
difficult. |
NOTE
1. Pilots
should report location(s), time (UTC),
intensity, whether in or near clouds,
altitude, type of aircraft and, when
applicable, duration of turbulence.
2. Duration may
be based on time between two locations or
over a single location. All locations should
be readily identifiable. |
|
Severe
|
Turbulence that
causes large, abrupt changes in altitude
and/or attitude. It usually causes large
variations in indicated airspeed. Aircraft
may be momentarily out of control. Report
as Severe Turbulence. 1
|
Occupants are
forced violently against seat belts or
shoulder straps. Unsecured objects are
tossed about. Food Service and walking are
impossible. |
EXAMPLES:
a. Over Omaha.
1232Z, Moderate Turbulence, in cloud, Flight
Level 310, B707. |
|
Extreme
|
Turbulence in
which the aircraft is violently tossed about
and is practically impossible to control. It
may cause structural damage. Report as
Extreme Turbulence. 1
|
|
b. From 50
miles south of Albuquerque to 30 miles north
of Phoenix, 1210Z to 1250Z, occasional
Moderate Chop, Flight Level 330, DC8.
|
|
1
High level turbulence (normally above 15,000
feet ASL) not associated with cumuliform
cloudiness, including thunderstorms, should
be reported as CAT (clear air turbulence)
preceded by the appropriate intensity, or
light or moderate chop. |
7-1-22.
Wind Shear PIREP's
a.
Because unexpected
changes in wind speed and direction can be
hazardous to aircraft operations at low
altitudes on approach to and departing from
airports, pilots are urged to promptly volunteer
reports to controllers of wind shear conditions
they encounter. An advance warning of this
information will assist other pilots in avoiding
or coping with a wind shear on approach or
departure.
b.
When describing
conditions, use of the terms "negative" or
"positive" wind shear should be avoided. PIREP's
of "negative wind shear on final,"
intended to describe loss of airspeed and lift,
have been interpreted to mean that no wind shear
was encountered. The recommended method for wind
shear reporting is to state the loss or gain of
airspeed and the altitudes at which it was
encountered.
EXAMPLE-
1.
Denver Tower, Cessna 1234 encountered
wind shear, loss of 20 knots at 400.
2. Tulsa Tower, American 721
encountered wind shear on final, gained 25 knots
between 600 and 400 feet followed by loss of 40
knots between 400 feet and surface.
1.
Pilots who are not
able to report wind shear in these specific
terms are encouraged to make reports in terms of
the effect upon their aircraft.
EXAMPLE-
Miami Tower, Gulfstream 403 Charlie encountered
an abrupt wind shear at 800 feet on final, max
thrust required.
2.
Pilots using
Inertial Navigation Systems (INS's) should
report the wind and altitude both above and
below the shear level.
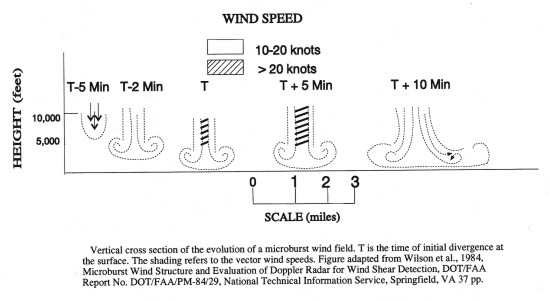
FIG 7-1-7
Evolution of a
Microburst
7-1-23.
Clear Air Turbulence (CAT) PIREP's
CAT has become a very serious operational factor
to flight operations at all levels and especially
to jet traffic flying in excess of 15,000 feet.
The best available information on this phenomenon
must come from pilots via the PIREP reporting
procedures. All pilots encountering CAT conditions
are urgently requested to report time, location,
and intensity (light, moderate, severe, or
extreme) of the element to the FAA facility with
which they are maintaining radio contact. If time
and conditions permit, elements should be reported
according to the standards for other PIREP's and
position reports.
REFERENCE-
AIM, PIREP's Relating to Turbulence, Paragraph 7-1-21.
7-1-24.
Microbursts
a.
Relatively recent
meteorological studies have confirmed the
existence of microburst phenomenon. Microbursts
are small scale intense downdrafts which, on
reaching the surface, spread outward in all
directions from the downdraft center. This
causes the presence of both vertical and
horizontal wind shears that can be extremely
hazardous to all types and categories of
aircraft, especially at low altitudes. Due to
their small size, short life span, and the fact
that they can occur over areas without surface
precipitation, microbursts are not easily
detectable using conventional weather radar or
wind shear alert systems.
b.
Parent clouds
producing microburst activity can be any of the
low or middle layer convective cloud types.
Note, however, that microbursts commonly occur
within the heavy rain portion of thunderstorms,
and in much weaker, benign appearing convective
cells that have little or no precipitation
reaching the ground.
c.
The life cycle of a
microburst as it descends in a convective rain
shaft is seen in FIG 7-1-7.
An important consideration for pilots is the
fact that the microburst intensifies for about 5
minutes after it strikes the ground.
d. Characteristics
of microbursts include:
1. Size.
The
microburst downdraft is typically less than 1
mile in diameter as it descends from the cloud
base to about 1,000-3,000 feet above the
ground. In the transition zone near the
ground, the downdraft changes to a horizontal
outflow that can extend to approximately 2
1/2 miles in diameter.
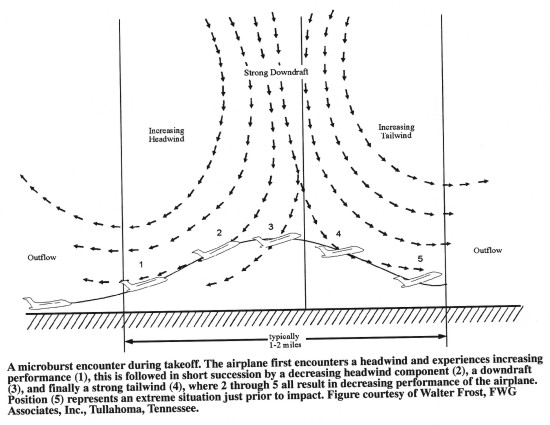
FIG 7-1-8
Microburst
Encounter During Takeoff
2. Intensity.
The
downdrafts can be as strong as 6,000 feet per
minute. Horizontal winds near the surface can
be as strong as 45 knots resulting in a 90
knot shear (headwind to tailwind change for a
traversing aircraft) across the microburst.
These strong horizontal winds occur within a
few hundred feet of the ground.
3. Visual Signs.
Microbursts can be found almost anywhere that
there is convective activity. They may be
embedded in heavy rain associated with a
thunderstorm or in light rain in benign
appearing virga. When there is little or no
precipitation at the surface accompanying the
microburst, a ring of blowing dust may be the
only visual clue of its existence.
4. Duration.
An
individual microburst will seldom last longer
than 15 minutes from the time it strikes the
ground until dissipation. The horizontal winds
continue to increase during the first 5
minutes with the maximum intensity winds
lasting approximately 2-4 minutes. Sometimes
microbursts are concentrated into a line
structure, and under these conditions,
activity may continue for as long as an hour.
Once microburst activity starts, multiple
microbursts in the same general area are not
uncommon and should be expected.
e.
Microburst wind
shear may create a severe hazard for aircraft
within 1,000 feet of the ground, particularly
during the approach to landing and landing and
take-off phases. The impact of a microburst on
aircraft which have the unfortunate experience
of penetrating one is characterized in
FIG 7-1-8. The aircraft
may encounter a headwind (performance
increasing) followed by a downdraft and tailwind
(both performance decreasing), possibly
resulting in terrain impact.
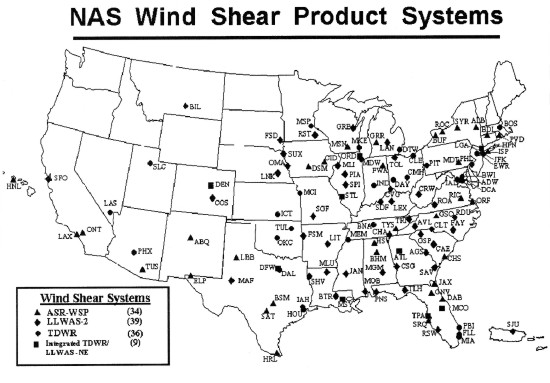
FIG 7-1-9
f. Detection of
Microbursts, Wind Shear and Gust Fronts.
1. FAA's
Integrated Wind Shear Detection Plan.
(a)
The FAA currently employs an integrated plan
for wind shear detection that will
significantly improve both the safety and
capacity of the majority of the airports
currently served by the air carriers. This
plan integrates several programs, such as
the Integrated Terminal Weather System (ITWS),
Terminal Doppler Weather Radar (TDWR),
Weather System Processor (WSP), and Low
Level Wind Shear Alert Systems (LLWAS) into
a single strategic concept that
significantly improves the aviation weather
information in the terminal area. (See FIG
7-1-9.)
(b)
The wind shear/microburst information and
warnings are displayed on the ribbon display
terminals (RBDT) located in the tower cabs.
They are identical (and standardized) in the
LLWAS, TDWR and WSP systems, and so designed
that the controller does not need to
interpret the data, but simply read the
displayed information to the pilot. The
RBDT's are constantly monitored by the
controller to ensure the rapid and timely
dissemination of any hazardous event(s) to
the pilot.
(c)
The early detection of a wind
shear/micro-burst event, and the subsequent
warning(s) issued to an aircraft on approach
or departure, will alert the pilot/crew to
the potential of, and to be prepared for, a
situation that could become very dangerous!
Without these warnings, the aircraft may NOT
be able to climb out of, or safely
transition, the event, resulting in a
catastrophe. The air carriers, working with
the FAA, have developed specialized training
programs using their simulators to train and
prepare their pilots on the demanding
aircraft procedures required to escape these
very dangerous wind shear and/or microburst
encounters.
FIG 7-1-10
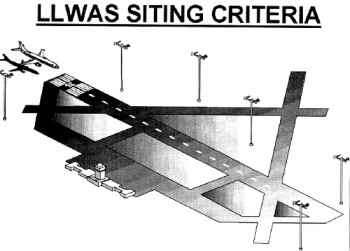
2. Low Level Wind
Shear Alert System (LLWAS).
(a)
The LLWAS provides wind data and software
processes to detect the presence of
hazardous wind shear and microbursts in the
vicinity of an airport. Wind sensors,
mounted on poles sometimes as high as 150
feet, are (ideally) located 2,000 - 3,500
feet, but not more than 5,000 feet, from the
centerline of the runway. (See FIG 7-1-10.)
(b)
LLWAS was fielded in 1988 at 110 airports
across the nation. Many of these systems
have been replaced by new TDWR and WSP
technology. Eventually all LLWAS systems
will be phased out; however, 39 airports
will be upgraded to the LLWAS-NE (Network
Expansion) system, which employs the very
latest software and sensor technology. The
new LLWAS-NE systems will not only provide
the controller with wind shear warnings and
alerts, including wind shear/microburst
detection at the centerfield wind sensor
location, but will also provide the location
of the hazards relative to the airport
runway(s). It will also have the flexibility
and capability to grow with the airport as
new runways are built. As many as 32
sensors, strategically located around the
airport and in relationship to its runway
configuration, can be accommodated by the
LLWAS-NE network.
FIG 7-1-11
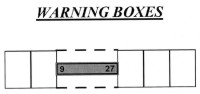
3. Terminal
Doppler Weather Radar (TDWR).
(a)
TDWR's are being deployed at 45 locations
across the U.S.. Optimum locations for
TDWR's are 8 to 12 miles off of the airport
proper, and designed to look at the airspace
around and over the airport to detect
microbursts, gust fronts, wind shifts and
precipitation intensities. TDWR products
advise the controller of wind shear and
microburst events impacting all runways and
the areas 1/2 mile on
either side of the extended centerline of
the runways out to 3 miles on final approach
and 2 miles out on departure.
(FIG 7-1-11 is a theoretical view of the
warning boxes, including the runway, that
the software uses in determining the
location(s) of wind shear or microbursts).
These warnings are displayed (as depicted in
the examples in subparagraph 5) on the RBDT.
(b)
It is very important to understand what TDWR
does NOT DO:
It DOES NOT
warn of wind shear outside of the alert
boxes (on the arrival and departure ends of
the runways);
It DOES NOT
detect wind shear that is NOT a microburst
or a gust front;
It DOES NOT
detect gusty or cross wind conditions; and
It DOES NOT
detect turbulence.
However,
research and development is continuing on
these systems. Future improvements may
include such areas as storm motion
(movement), improved gust front detection,
storm growth and decay, microburst
prediction, and turbulence detection.
(c)
TDWR also provides a geographical situation
display (GSD) for supervisors and traffic
management specialists for planning
purposes. The GSD displays (in color) 6
levels of weather (precipitation), gust
fronts and predicted storm movement(s). See
FIG 7-1-12 for a sample of what that display
looks like. This data is used by the tower
supervisor(s), traffic management
specialists and controllers to plan for
runway changes and arrival/departure route
changes in order to both reduce aircraft
delays and increase airport capacity.
FIG 7-1-12
4. Weather System
Processor (WSP).
(a)
The WSP provides the controller, supervisor,
traffic management specialist, and
ultimately the pilot, with the same products
as the terminal doppler weather radar (TDWR)
at a fraction of the cost of a TDWR. This is
accomplished by utilizing new technologies
to access the weather channel capabilities
of the existing ASR-9 radar located on or
near the airport, thus eliminating the
requirements for a separate radar location,
land acquisition, support facilities and the
associated communication landlines and
expenses.
(b)
The WSP utilizes the same RBDT display as
the TDWR and LLWAS, and, just like TDWR,
also has a GSD for planning purposes by
supervisors, traffic management specialists
and controllers. The WSP GSD emulates the
TDWR display, i.e., it also depicts 6 levels
of precipitation, gust fronts and predicted
storm movement, and like the TDWR GSD, is
used to plan for runway changes and
arrival/departure route changes in order to
reduce aircraft delays and to increase
airport capacity.
(c)
This system is currently under development
and is operating in a developmental test
status at the Albuquerque, New Mexico,
airport. When fielded, the WSP is expected
to be installed at 34 airports across the
nation, substantially increasing the safety
of the American flying public.
5. Operational
aspects of LLWAS, TDWR and WSP.
To demonstrate
how this data is used by both the controller
and the pilot, 3 ribbon display examples and
their explanations are presented:
(a) MICROBURST
ALERTS
EXAMPLE-
This is what the controller sees on his/her
ribbon display in the tower cab.
NOTE-
(See FIG 7-1-13 to
see how the TDWR/WSP determines the
microburst location).
This is what
the controller will say when issuing the
alert.
PHRASEOLOGY-
RUNWAY 27 ARRIVAL, MICROBURST ALERT, 35 KT
LOSS 2 MILE FINAL, THRESHOLD WIND 250 AT 20.
In plain
language, the controller is telling the
pilot that on approach to runway 27, there
is a microburst alert on the approach lane
to the runway, and to anticipate or expect a
35 knot loss of airspeed at approximately 2
miles out on final approach (where it will
first encounter the phenomena). With that
information, the aircrew is forewarned, and
should be prepared to apply wind
shear/microburst escape procedures should
they decide to continue the approach.
Additionally, the surface winds at the
airport for landing runway 27 are reported
as 250 degrees at 20 knots.
NOTE-
Threshold wind is at pilot's request or as
deemed appropriate by the controller.
REFERENCE-
FAA Order
7110.65, Air Traffic Control, Paragraph
3-1-8b2(a).
(b) WIND SHEAR
ALERTS
EXAMPLE-
This is what the controller sees on his/her
ribbon display in the tower cab.
NOTE-
(See FIG 7-1-14 to
see how the TDWR/WSP determines the wind
shear location).
This is what
the controller will say when issuing the
alert.
PHRASEOLOGY-
RUNWAY 27 ARRIVAL, WIND SHEAR ALERT, 20 KT
LOSS 3 MILE FINAL, THRESHOLD WIND 200 AT 15.
In plain
language, the controller is advising the
aircraft arriving on runway 27 that at about
3 miles out they can expect to encounter a
wind shear condition that will decrease
their airspeed by 20 knots and possibly
encounter turbulence. Additionally, the
airport surface winds for landing runway 27
are reported as 200 degrees at 15 knots.
NOTE-
Threshold wind is at pilot's request or as
deemed appropriate by the controller.
REFERENCE-
FAA Order
7110.65, Air Traffic Control, Paragraph
3-1-8b2(a).
FIG 7-1-13
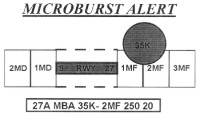
FIG 7-1-14
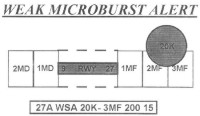
FIG 7-1-15
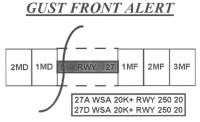
(c) MULTIPLE
WIND SHEAR ALERTS
EXAMPLE-
This is what the controller sees on his/her
ribbon display in the tower cab.
|
27A WSA
20K+ RWY 250 20 |
|
27D WSA
20K+ RWY 250 20 |
NOTE-
(See FIG 7-1-15 to
see how the TDWR/WSP determines the gust
front/wind shear location.)
This is what
the controller will say when issuing the
alert.
PHRASEOLOGY-
MULTIPLE WIND SHEAR ALERTS. RUNWAY 27
ARRIVAL, WIND SHEAR ALERT, 20 KT GAIN ON
RUNWAY; RUNWAY 27 DEPARTURE, WIND SHEAR
ALERT, 20 KT GAIN ON RUNWAY, WIND 250 AT 20.
EXAMPLE-
In this example, the controller is advising
arriving and departing aircraft that they
could encounter a wind shear condition right
on the runway due to a gust front
(significant change of wind direction) with
the possibility of a 20 knot gain in
airspeed associated with the gust front.
Additionally, the airport surface winds (for
the runway in use) are reported as 250
degrees at 20 knots.
REFERENCE-
FAA Order
7110.65, Air Traffic Control, Paragraph
3-1-8b2(d).
6. The Terminal
Weather Information for Pilots System (TWIP).
(a)
With the increase in the quantity and
quality of terminal weather information
available through TDWR, the next step is to
provide this information directly to pilots
rather than relying on voice communications
from ATC. The National Airspace System has
long been in need of a means of delivering
terminal weather information to the cockpit
more efficiently in terms of both speed and
accuracy to enhance pilot awareness of
weather hazards and reduce air traffic
controller workload. With the TWIP
capability, terminal weather information,
both alphanumerically and graphically, is
now available directly to the cockpit on a
test basis at 9 locations.
(b)
TWIP products are generated using weather
data from the TDWR or the Integrated
Terminal Weather System (ITWS) testbed. TWIP
products are generated and stored in the
form of text and character graphic messages.
Software has been developed to allow TDWR or
ITWS to format the data and send the TWIP
products to a database resident at
Aeronautical Radio, Inc. (ARINC). These
products can then be accessed by pilots
using the ARINC Aircraft Communications
Addressing and Reporting System (ACARS) data
link services. Airline dispatchers can also
access this database and send messages to
specific aircraft whenever wind shear
activity begins or ends at an airport.
(c)
TWIP products include descriptions and
character graphics of microburst alerts,
wind shear alerts, significant
precipitation, convective activity within 30
NM surrounding the terminal area, and
expected weather that will impact airport
operations. During inclement weather, i.e.,
whenever a predetermined level of
precipitation or wind shear is detected
within 15 miles of the terminal area, TWIP
products are updated once each minute for
text messages and once every five minutes
for character graphic messages. During good
weather (below the predetermined
precipitation or wind shear parameters) each
message is updated every 10 minutes. These
products are intended to improve the
situational awareness of the pilot/flight
crew, and to aid in flight planning prior to
arriving or departing the terminal area. It
is important to understand that, in the
context of TWIP, the predetermined levels
for inclement versus good weather has
nothing to do with the criteria for VFR/MVFR/IFR/LIFR;
it only deals with precipitation, wind
shears and microbursts.
7-1-25.
PIREP's Relating to Volcanic Ash Activity
a.
Volcanic eruptions
which send ash into the upper atmosphere occur
somewhere around the world several times each
year. Flying into a volcanic ash cloud can be
extremely dangerous. At least two B747's have
lost all power in all four engines after such an
encounter. Regardless of the type aircraft, some
damage is almost certain to ensue after an
encounter with a volcanic ash cloud.
b.
While some
volcanoes in the U.S. are monitored, many in
remote areas are not. These unmonitored
volcanoes may erupt without prior warning to the
aviation community. A pilot observing a volcanic
eruption who has not had previous notification
of it may be the only witness to the eruption.
Pilots are strongly encouraged to transmit a
PIREP regarding volcanic eruptions and any
observed volcanic ash clouds.
c.
Pilots should
submit PIREP's regarding volcanic activity using
the Volcanic Activity Reporting (VAR) form as
illustrated in Appendix 2. If a VAR form is not
immediately available, relay enough information
to identify the position and type of volcanic
activity.
d.
Pilots should
verbally transmit the data required in items 1
through 8 of the VAR as soon as possible. The
data required in items 9 through 16 of the VAR
should be relayed after landing if possible.
7-1-26.
Thunderstorms
a.
Turbulence, hail,
rain, snow, lightning, sustained updrafts and
downdrafts, icing conditions-all are present in
thunderstorms. While there is some evidence that
maximum turbulence exists at the middle level of
a thunderstorm, recent studies show little
variation of turbulence intensity with altitude.
b.
There is no useful
correlation between the external visual
appearance of thunderstorms and the severity or
amount of turbulence or hail within them. The
visible thunderstorm cloud is only a portion of
a turbulent system whose updrafts and downdrafts
often extend far beyond the visible storm cloud.
Severe turbulence can be expected up to 20 miles
from severe thunderstorms. This distance
decreases to about 10 miles in less severe
storms.
c.
Weather radar,
airborne or ground based, will normally reflect
the areas of moderate to heavy precipitation
(radar does not detect turbulence). The
frequency and severity of turbulence generally
increases with the radar reflectivity which is
closely associated with the areas of highest
liquid water content of the storm. NO FLIGHT
PATH THROUGH AN AREA OF STRONG OR VERY STRONG
RADAR ECHOES SEPARATED BY 20-30 MILES OR LESS
MAY BE CONSIDERED FREE OF SEVERE TURBULENCE.
d.
Turbulence beneath
a thunderstorm should not be minimized. This is
especially true when the relative humidity is
low in any layer between the surface and 15,000
feet. Then the lower altitudes may be
characterized by strong out flowing winds and
severe turbulence.
e.
The probability of
lightning strikes occurring to aircraft is
greatest when operating at altitudes where
temperatures are between minus 5 degrees Celsius
and plus 5 degrees Celsius. Lightning can strike
aircraft flying in the clear in the vicinity of
a thunderstorm.
f.
METAR reports do
not include a descriptor for severe
thunderstorms. However, by understanding severe
thunderstorm criteria, i.e., 50 knot winds or
3/4 inch hail, the
information is available in the report to know
that one is occurring.
g.
NWS radar systems
are able to objectively determine radar weather
echo intensity levels by use of Video Integrator
Processor (VIP) equipment. These thunderstorm
intensity levels are on a scale of one to six.
REFERENCE-
Pilot/Controller Glossary, Radar Weather
Echo Intensity Levels.
EXAMPLE-
1.
Alert provided by an ATC facility to an
aircraft:
(aircraft identification) level five intense
weather echo between ten o'clock and two
o'clock, one zero miles, moving east at two zero
knots, tops Flight Level three nine zero.
2. Alert provided by an AFSS/FSS:
(aircraft identification) level five intense
weather echo, two zero miles west of Atlanta
V-O-R, two five miles wide, moving east at two
zero knots, tops Flight Level three nine zero.
7-1-27.
Thunderstorm Flying
a.
Above all, remember
this: never regard any thunderstorm "lightly"
even when radar observers report the echoes are
of light intensity. Avoiding thunderstorms is
the best policy. Following are some Do's and
Don'ts of thunderstorm avoidance:
1.
Don't land or
takeoff in the face of an approaching
thunderstorm. A sudden gust front of low level
turbulence could cause loss of control.
2.
Don't attempt to
fly under a thunderstorm even if you can see
through to the other side. Turbulence and wind
shear under the storm could be disastrous.
3.
Don't fly without
airborne radar into a cloud mass containing
scattered embedded thunderstorms. Scattered
thunderstorms not embedded usually can be
visually circumnavigated.
4.
Don't trust the
visual appearance to be a reliable indicator
of the turbulence inside a thunderstorm.
5.
Do avoid by at
least 20 miles any thunderstorm identified as
severe or giving an intense radar echo. This
is especially true under the anvil of a large
cumulonimbus.
6.
Do clear the top
of a known or suspected severe thunderstorm by
at least 1,000 feet altitude for each 10 knots
of wind speed at the cloud top. This should
exceed the altitude capability of most
aircraft.
7.
Do circumnavigate
the entire area if the area has 6/10
thunderstorm coverage.
8.
Do remember that
vivid and frequent lightning indicates the
probability of a strong thunderstorm.
9.
Do regard as
extremely hazardous any thunderstorm with tops
35,000 feet or higher whether the top is
visually sighted or determined by radar.
b.
If you cannot avoid
penetrating a thunderstorm, following are some
Do's before entering the storm:
1.
Tighten your
safety belt, put on your shoulder harness if
you have one and secure all loose objects.
2. Plan and hold your course to take you
through the storm in a minimum time.
3.
To avoid the most
critical icing, establish a penetration
altitude below the freezing level or above the
level of minus 15 degrees Celsius.
4.
Verify that pitot
heat is on and turn on carburetor heat or jet
engine anti-ice. Icing can be rapid at any
altitude and cause almost instantaneous power
failure and/or loss of airspeed indication.
5.
Establish power
settings for turbulence penetration airspeed
recommended in your aircraft manual.
6.
Turn up cockpit
lights to highest intensity to lessen
temporary blindness from lightning.
7.
If using
automatic pilot, disengage altitude hold mode
and speed hold mode. The automatic altitude
and speed controls will increase maneuvers of
the aircraft thus increasing structural
stress.
8.
If using airborne
radar, tilt the antenna up and down
occasionally. This will permit you to detect
other thunderstorm activity at altitudes other
than the one being flown.
c.
Following are some
Do's and Don'ts during the thunderstorm
penetration:
1.
Do keep your eyes
on your instruments. Looking outside the
cockpit can increase danger of temporary
blindness from lightning.
2.
Don't change
power settings; maintain settings for the
recommended turbulence penetration airspeed.
3.
Do maintain
constant attitude; let the aircraft "ride the
waves." Maneuvers in trying to maintain
constant altitude increase stress on the
aircraft.
4.
Don't turn back
once you are in the thunderstorm. A straight
course through the storm most likely will get
you out of the hazards most quickly. In
addition, turning maneuvers increase stress on
the aircraft.
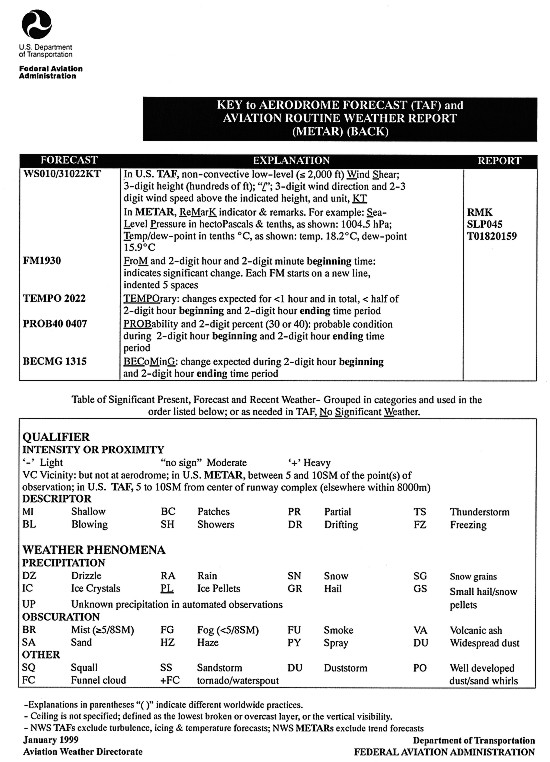
7-1-28.
Key to Aerodrome Forecast (TAF) and Aviation
Routine Weather Report (METAR)
|
FIG 7-1-16
FIG 7-1-17
|
7-1-29.
International Civil Aviation Organization (ICAO)
Weather Formats
The U.S. uses the ICAO world standard for aviation
weather reporting and forecasting. The utilization
of terminal forecasts affirms our commitment to a
single global format for aviation weather. The
World Meteorological Organization's (WMO)
publication No. 782 "Aerodrome Reports and
Forecasts" contains the base METAR and TAF code as
adopted by the WMO member countries.
a.
Although the METAR
code is adopted worldwide, each country is
allowed to make modifications or exceptions to
the code for use in their particular country,
e.g., the U.S. will continue to use statute
miles for visibility, feet for RVR values, knots
for wind speed, and inches of mercury for
altimetry. However, temperature and dew point
will be reported in degrees Celsius. The U.S.
will continue reporting prevailing visibility
rather than lowest sector visibility. Most of
the current U.S. observing procedures and
policies will continue after the METAR
conversion date, with the information
disseminated in the METAR code and format. The
elements in the body of a METAR report are
separated with a space. The only exceptions are
RVR, temperature and dew point, which are
separated with a solidus (/). When an element
does not occur, or cannot be observed,
the preceding space and that element are omitted
from that particular report. A METAR report
contains the following sequence of elements in
the following order:
1. Type of
report.
2. ICAO Station
Identifier.
3. Date and time
of report.
4. Modifier (as
required).
5. Wind.
6. Visibility.
7. Runway Visual
Range (RVR).
8. Weather
phenomena.
9. Sky
conditions.
10.
Temperature/dew point group.
11. Altimeter.
12. Remarks (RMK).
b.
The following
paragraphs describe the elements in a METAR
report.
1. Type of
Report.
There are two
types of report:
(a)
Aviation
Routine Weather Report (METAR); and
(b)
Nonroutine
(Special) Aviation Weather Report (SPECI).
The type of
report (METAR or SPECI) will always appear as
the lead element of the report.
2. ICAO Station
Identifier.
The METAR code
uses ICAO 4-letter station identifiers. In the
contiguous 48 States, the 3-letter domestic
station identifier is prefixed with a "K;"
i.e., the domestic identifier for Seattle is
SEA while the ICAO identifier is KSEA.
Elsewhere, the first two letters of the ICAO
identifier indicate what region of the world
and country (or state) the station is in. For
Alaska, all station identifiers start with
"PA;" for Hawaii, all station identifiers
start with "PH." Canadian station identifiers
start with "CU," "CW," "CY," and "CZ." Mexican
station identifiers start with "MM." The
identifier for the western Caribbean is "M"
followed by the individual country's letter;
i.e., Cuba is "MU;" Dominican Republic "MD;"
the Bahamas "MY." The identifier for the
eastern Caribbean is "T" followed by the
individual country's letter; i.e., Puerto Rico
is "TJ." For a complete worldwide listing see
ICAO Document 7910, Location Indicators.
3. Date and Time
of Report.
The date and time
the observation is taken are transmitted as a
six-digit date/time group appended with Z to
denote Coordinated Universal Time (UTC). The
first two digits are the date followed with
two digits for hour and two digits for
minutes.
EXAMPLE-
172345Z (the 17th day of the month
at 2345Z)
4. Modifier (As
Required).
"AUTO" identifies
a METAR/SPECI report as an automated weather
report with no human intervention. If "AUTO"
is shown in the body of the report, the type
of sensor equipment used at the station will
be encoded in the remarks section of the
report. The absence of "AUTO" indicates that a
report was made manually by an observer or
that an automated report had human
augmentation/backup. The modifier "COR"
indicates a corrected report that is sent out
to replace an earlier report with an error.
NOTE-
There are two types of automated stations, AO1
for automated weather reporting stations
without a precipitation discriminator, and AO2
for automated stations with a precipitation
discriminator. (A precipitation discriminator
can determine the difference between liquid
and frozen/freezing precipitation). This
information appears in the remarks section of
an automated report.
5. Wind.
The wind is
reported as a five digit group (six digits if
speed is over 99 knots). The first three
digits are the direction the wind is blowing
from, in tens of degrees referenced to true
north, or "VRB" if the direction is variable.
The next two digits is the wind speed in
knots, or if over 99 knots, the next three
digits. If the wind is gusty, it is reported
as a "G" after the speed followed by the
highest gust reported. The abbreviation "KT"
is appended to denote the use of knots for
wind speed.
EXAMPLE-
13008KT - wind from 130 degrees at 8 knots
08032G45KT - wind from 080 degrees at 32 knots
with gusts to 45 knots
VRB04KT - wind variable in direction at 4
knots
00000KT - wind calm
210103G130KT - wind from 210 degrees at 103
knots with gusts to 130 knots
If the wind direction is variable by 60
degrees or more and the speed is greater than
6 knots, a variable group consisting of the
extremes of the wind direction separated by a
"v" will follow the prevailing wind group.
32012G22KT 280V350
(a) Peak
Wind.
Whenever the
peak wind exceeds 25 knots "PK WND" will be
included in Remarks, e.g., PK WND 28045/1955
"Peak wind two eight zero at four five
occurred at one niner five five." If the
hour can be inferred from the report time,
only the minutes will be appended, e.g., PK
WND 34050/38 "Peak wind three four zero at
five zero occurred at three eight past the
hour."
(b) Wind
shift.
Whenever a wind
shift occurs, "WSHFT" will be included in
remarks followed by the time the wind shift
began, e.g., WSHFT 30 FROPA "Wind shift at
three zero due to frontal passage."
6. Visibility.
Prevailing visibility is reported in statute
miles with "SM" appended to it.
EXAMPLE-
7SM - seven statute miles
15SM - fifteen statute miles
1/2SM - one-half statute
mile
(a)
Tower/surface visibility.
If either
visibility (tower or surface) is below four
statute miles, the lesser of the two will be
reported in the body of the report; the
greater will be reported in remarks.
(b) Automated
visibility.
ASOS
visibility stations will show visibility ten
or greater than ten miles as "10SM." AWOS
visibility stations will show visibility
less than 1/4 statute
mile as "M1/4SM" and
visibility ten or greater than ten miles as
"10SM."
(c) Variable
visibility.
Variable
visibility is shown in remarks (when rapid
increase or decrease by 1/2
statute mile or more and the average
prevailing visibility is less than three
miles) e.g., VIS 1V2 "visibility variable
between one and two."
(d) Sector
visibility.
Sector
visibility is shown in remarks when it
differs from the prevailing visibility, and
either the prevailing or sector visibility
is less than three miles.
EXAMPLE-
VIS
N2 - visibility north two
7. Runway Visual
Range (When Reported).
"R" identifies the group followed by the
runway heading (and parallel runway
designator, if needed) "/" and the visual
range in feet (meters in other countries)
followed with "FT" (feet is not spoken).
(a) Variability
Values.
When RVR varies
(by more than on reportable value), the
lowest and highest values are shown with "V"
between them.
(b)
Maximum/Minimum Range.
"P" indicates
an observed RVR is above the maximum value
for this system (spoken as "more than"). "M"
indicates an observed RVR is below the
minimum value which can be determined by the
system (spoken as "less than").
EXAMPLE-
R32L/1200FT - runway three two left R-V-R
one thousand two hundred.
R27R/M1000V4000FT - runway two seven right
R-V-R variable from less than one thousand
to four thousand.
8. Weather
Phenomena.
The weather as
reported in the METAR code represents a
significant change in the way weather is
currently reported. In METAR, weather is
reported in the format:
Intensity/Proximity/Descriptor/Precipitation/Obstruction
to visibility/Other
NOTE-
The "/" above and in the following
descriptions (except as the separator between
the temperature and dew point) are for
separation purposes in this publication and do
not appear in the actual METAR's.
(a)
Intensity
applies only to
the first type of precipitation reported. A
"-" denotes light, no symbol denotes
moderate, and a "+" denotes heavy.
(b)
Proximity
applies to and reported only for weather
occurring in the vicinity of the airport
(between 5 and 10 miles of the point(s) of
observation). It is denoted by the letters
"VC." (Intensity and "VC" will not appear
together in the weather group).
(c)
Descriptor.
These eight
descriptors apply to the precipitation or
obstructions to visibility:
TS thunderstorm
DR low drifting
SH showers
MI shallow
FZ freezing
BC patches
BL blowing
PR partial
NOTE-
Although "TS" and "SH" are used with
precipitation and may be preceded with an
intensity symbol, the intensity still
applies to the precipitation, not
the descriptor.
(d)
Precipitation.
There are nine
types of precipitation in the METAR code:
RA rain
DZ drizzle
SN snow
GR hail (1/4"
or greater)
GS small hail/snow pellets
PL ice pellets
SG snow grains
IC ice crystals (diamond dust)
UP unknown precipitation
(automated stations only)
(e)
Obstructions to visibility.
There are eight
types of obscuration phenomena in the METAR
code (obscurations are any phenomena in the
atmosphere, other than precipitation, that
reduce horizontal visibility):
FG fog (vsby less than 5/8
mile)
HZ haze
FU smoke
PY spray
BR mist (vsby 5/8
- 6 miles)
SA sand
DU dust
VA volcanic ash
NOTE-
Fog (FG) is observed or forecast only when
the visibility is less than five-eighths of
mile, otherwise mist (BR) is observed or
forecast.
(f)
Other.
There are five
categories of other weather phenomena which
are reported when they occur:
SQ squall
SS sandstorm
DS duststorm
PO dust/sand whirls
FC funnel cloud
+FC tornado/waterspout
Examples:
TSRA
thunderstorm with moderate rain
+SN heavy snow
-RA FG light rain and fog
BRHZ mist and haze (visibility 5/8
mile or greater)
FZDZ freezing drizzle
VCSH rain shower in the vicinity
+SHRASNPL heavy rain showers, snow,
ice pellets (intensity indicator refers
to the predominant rain)
9. Sky Condition.
The
sky condition as reported in METAR represents
a significant change from the way sky
condition is currently reported. In METAR, sky
condition is reported in the format:
Amount/Height/(Type) or Indefinite
Ceiling/Height
(a)
Amount.
The amount of
sky cover is reported in eighths of sky
cover, using the contractions:
SKC clear (no clouds)
FEW >0 to 2/8
SCT scattered (3/8's
to 4/8's of clouds)
BKN broken (5/8's
to 7/8's of clouds)
OVC overcast (8/8's
clouds)
CB Cumulonimbus when present
TCU Towering cumulus when present
NOTE-
1. "SKC" will be reported at manual
stations. "CLR" will be used at automated
stations when no clouds below 12,000 feet
are reported.
2. A ceiling layer is not
designated in the METAR code. For aviation
purposes, the ceiling is the lowest broken
or overcast layer, or vertical visibility
into an obscuration. Also there is no
provision for reporting thin layers in the
METAR code. When clouds are thin, that layer
shall be reported as if it were opaque.
(b) Height.
Cloud bases are reported with three digits
in hundreds of feet. (Clouds above 12,000
feet cannot be reported by an automated
station).
(c) (Type).
If
Towering Cumulus Clouds (TCU) or
Cumulonimbus Clouds (CB) are present, they
are reported after the height which
represents their base.
EXAMPLE-
(Reported as) SCT025TCU BKN080 BKN250
(spoken as) "TWO THOUSAND FIVE HUNDRED
SCATTERED TOWERING CUMULUS, CEILING EIGHT
THOUSAND BROKEN, TWO FIVE THOUSAND BROKEN."
(Reported as) SCT008 OVC012CB (spoken as)
"EIGHT HUNDRED SCATTERED CEILING ONE
THOUSAND TWO HUNDRED OVERCAST CUMULONIMBUS
CLOUDS."
(d)
Vertical Visibility (indefinite ceiling
height).
The height into
an indefinite ceiling is preceded by "VV"
and followed by three digits indicating the
vertical visibility in hundreds of feet.
This layer indicates total obscuration.
EXAMPLE-
1/8 SM FG VV006 -
visibility one eighth, fog, indefinite
ceiling six hundred.
(e)
Obscurations
are reported when the sky is partially
obscured by a ground-based phenomena by
indicating the amount of obscuration as FEW,
SCT, BKN followed by three zeros (000). In
remarks, the obscuring phenomenon precedes
the amount of obscuration and three zeros.
EXAMPLE-
BKN000 (in body) "sky partially obscured"
FU BKN000 (in remarks) "smoke obscuring
five- to seven-eighths of the sky"
(f)
When sky conditions include a layer aloft,
other than clouds, such as smoke or haze the
type of phenomena, sky cover and height are
shown in remarks.
EXAMPLE-
BKN020 (in body)
"ceiling two thousand broken"
RMK FU BKN020 "broken layer of smoke aloft,
based at two thousand"
(g)
Variable ceiling.
When a ceiling
is below three thousand and is variable, the
remark "CIG" will be shown followed with the
lowest and highest ceiling heights separated
by a "V."
EXAMPLE-
CIG 005V010 "ceiling variable between five
hundred and one thousand"
(h)
Second site sensor.
When an
automated station uses meteorological
discontinuity sensors, remarks will be shown
to identify site specific sky conditions
which differ and are lower than conditions
reported in the body.
EXAMPLE-
CIG 020 RY11 "ceiling two thousand at runway
one one"
(i)
Variable cloud layer.
When a layer is
varying in sky cover, remarks will show the
variability range. If there is more than one
cloud layer, the variable layer will be
identified by including the layer height.
EXAMPLE-
SCT V BKN "scattered layer variable to
broken"
BKN025 V OVC "broken layer at two thousand
five hundred variable to
overcast"
(j)
Significant clouds.
When
significant clouds are observed, they are
shown in remarks, along with the specified
information as shown below:
(1)
Cumulonimbus (CB), or Cumulonimbus
Mammatus (CBMAM), distance (if known),
direction from the station, and direction
of movement, if known. If the clouds are
beyond 10 miles from the airport, DSNT
will indicate distance.
EXAMPLE-
CB W MOV E "cumulonimbus west moving east"
CBMAM DSNT S "cumulonimbus mammatus
distant south"
(2)
Towering Cumulus (TCU), location, (if
known), or direction from the station.
EXAMPLE-
TCU OHD "towering cumulus overhead"
TCU W "towering cumulus west"
(3)
Altocumulus Castellanus (ACC),
Stratocumulus Standing Lenticular (SCSL),
Altocumulus Standing Lenticular (ACSL),
Cirrocumulus Standing Lenticular (CCSL) or
rotor clouds, describing the clouds (if
needed) and the direction from the
station.
EXAMPLE-
ACC W "altocumulus castellanus west"
ACSL SW-S "standing lenticular altocumulus
southwest through south"
APRNT ROTOR CLD S "apparent rotor cloud
south"
CCSL OVR MT E "standing lenticular
cirrocumulus over the mountains east"
10.
Temperature/Dew Point.
Temperature and
dew point are reported in two, two-digit
groups in degrees Celsius, separated by a
solidus ("/"). Temperatures below zero are
prefixed with an "M." If the temperature is
available but the dew point is missing, the
temperature is shown followed by a solidus. If
the temperature is missing, the group is
omitted from the report.
EXAMPLE-
15/08 "temperature one five, dew point 8"
00/M02 "temperature zero, dew point minus 2"
M05/ "temperature minus five, dew point
missing"
11. Altimeter.
Altimeter settings are reported in a
four-digit format in inches of mercury
prefixed with an "A" to denote the units of
pressure.
EXAMPLE-
A2995 - "Altimeter two niner niner five"
12. Remarks.
Remarks will be included in all observations,
when appropriate. The contraction "RMK"
denotes the start of the remarks section of a
METAR report.
Except for
precipitation, phenomena located within 5
statute miles of the point of observation will
be reported as at the station. Phenomena
between 5 and 10 statute miles will be
reported in the vicinity, "VC." Precipitation
not occurring at the point of observation but
within 10 statute miles is also reported as in
the vicinity, "VC."
Phenomena beyond 10 statute miles will be
shown as distant, "DSNT." Distances are in
statute miles except for automated lightning
remarks which are in nautical miles. Movement
of clouds or weather will be indicated by the
direction toward which the phenomena is
moving.
a.
There are two
categories of remarks:
1.
Automated, manual, and plain language.
2.
Additive
and automated maintenance data.
b. Automated,
Manual, and Plain Language.
This group of
remarks may be generated from either manual
or automated weather reporting stations and
generally elaborate on parameters reported
in the body of the report. (Plain language
remarks are only provided by manual
stations).
1.
Volcanic
eruptions.
2.
Tornado,
Funnel Cloud, Waterspout.
3.
Station
Type (AO1 or AO2).
4.
PK WND.
5.
WSHFT (FROPA).
6.
TWR VIS
or SFC VIS.
7.
VRB VIS.
8.
Sector
VIS.
9.
VIS @ 2nd
Site.
10.
(freq)
LTG (type) (loc).
11.
Beginning/Ending of Precipitation/TSTMS.
12.
TSTM
Location MVMT.
13.
Hailstone
Size (GR).
14.
Virga.
15.
VRB CIG
(height).
16.
Obscuration.
17.
VRB Sky
Condition.
18.
Significant Cloud Types.
19.
Ceiling
Height 2nd Location.
20.
PRESFR
PRESRR.
21.
Sea-Level
Pressure.
22.
ACFT
Mishap (not transmitted).
23.
NOSPECI.
24.
SNINCR.
25.
Other SIG
Info.
c. Additive and
Automated Maintenance Data.
1.
Hourly
Precipitation.
2.
3- and
6-Hour Precipitation Amount.
3.
24-Hour
Precipitation.
4.
Snow
Depth on Ground.
5.
Water
Equivalent of Snow.
6.
Cloud
Type.
7.
Duration
of Sunshine.
8.
Hourly
Temperature/Dew Point (Tenths).
9.
6-Hour
Maximum Temperature.
10.
6-Hour
Minimum Temperature.
11.
24-Hour
Maximum/Minimum Temperature.
12.
Pressure
Tendency.
13.
Sensor
Status.
PWINO
FZRANO
TSNO
RVRNO
PNO
VISNO
Examples of
METAR reports and explanation:
METAR KBNA
281250Z 33018KT 290V360 1/2SM R31/2700FT SN
BLSN FG VV008 00/M03 A2991 RMK RAE42SNB42
METAR aviation routine weather report
KBNA Nashville, TN
281250Z date 28th, time
1250 UTC
(no modifier) This is a manually
generated
report, due to the absence of
"AUTO" and "AO1 or AO2" in
remarks
33018KT wind three three zero at one
eight
290V360 wind variable between
two nine zero and three six zero
1/2SM visibility one half
R31/2700FT Runway three one RVR two
thousand seven hundred
SN moderate snow
BLSN FG visibility obscured by
blowing
snow and fog
VV008 indefinite ceiling eight
hundred
00/M03 temperature zero, dew point
minus three
A2991 altimeter two niner niner one
RMK remarks
RAE42 rain ended at four two
SNB42 snow began at four two
METAR KSFO
041453Z AUTO VRB02KT 3SM BR CLR 15/12 A3012
RMK AO2
METAR aviation routine weather report
KSFO San Francisco, CA
041453Z date 4th, time
1453 UTC
AUTO fully automated; no human
intervention
VRB02KT wind variable at two
3SM visibility three
BR visibility obscured by mist
CLR no clouds below one two
thousand
15/12 temperature one five, dew point
one two
A3012 altimeter three zero one two
RMK remarks
AO2 this automated station has a
weather discriminator (for
precipitation)
SPECI KCVG 152224Z 28024G36KT 3/4SM +TSRA
BKN008 OVC020CB 28/23 A3000 RMK TSRAB24 TS W
MOV E
SPECI (nonroutine) aviation special
weather report
KCVG Cincinnati, OH
152228Z date 15th, time
2228 UTC
(no modifier) This is a manually
generated
report due to the absence of "AUTO" and "AO1
or AO2" in remarks
28024G36KT wind two eight zero at two
four gusts three six
3/4SM visibility three fourths
+TSRA thunderstorms, heavy rain
BKN008 ceiling eight hundred broken
OVC020CB two thousand overcast
cumulonimbus clouds
28/23 temperature two eight, dew
point two three
A3000 altimeter three zero zero zero
RMK remarks
TSRAB24 thunderstorm and rain began
at
two four
TS W MOV E thunderstorm west moving
east
Aerodrome Forecast
(TAF). A
concise statement of the expected meteorological
conditions at an airport during a specified
period (usually 24 hours). TAF's use the same
codes as METAR weather reports. They are
scheduled four times daily for 24-hour periods
beginning at 0000Z, 0600Z, 1200Z, and 1800Z.
TAF's are issued in the following format:
TYPE OF REPORT/ICAO STATION IDENTIFIER/DATE AND
TIME OF ORIGIN/VALID PERIOD DATE AND
TIME/FORECAST METEOROLOGICAL CONDITIONS
NOTE-
The "/" above and in the following descriptions
are for separation purposes in this publication
and do not appear in the actual TAF's.
TAF
KOKC 051130Z 051212 14008KT 5SM BR BKN030 TEMPO
1316 1 1/2SM BR
FM1600 16010KT P6SM SKC
FM2300 20013G20KT 4SM SHRA OVC020
PROB40 0006 2SM TSRA OVC008CB BECMG 0608 21015KT
P6SM NSW SCT040
TAF format observed in the above example:
TAF = type of report
KOKC = ICAO station identifier
051130Z = date and time of origin
051212 = valid period date and times
14008KT 5SM BR BKN030 = forecast meteorological
conditions
Explanation of TAF elements:
1. Type of
report.
There are two
types of TAF issuances, a routine forecast
issuance (TAF) and an amended forecast (TAF
AMD). An amended TAF is issued when the
current TAF no longer adequately describes the
on-going weather or the forecaster feels the
TAF is not representative of the current or
expected weather. Corrected (COR) or delayed (RTD)
TAF's are identified only in the
communications header which precedes the
actual forecasts.
2. ICAO Station
Identifier.
The TAF code uses
ICAO 4-letter location identifiers as
described in the METAR section.
3. Date and Time
of Origin.
This element is
the date and time the forecast is actually
prepared. The format is a two-digit date and
four-digit time followed, without a space, by
the letter "Z."
4. Valid Period
Date and Time.
The UTC valid
period of the forecast is a two-digit date
followed by the two-digit beginning hour and
two-digit ending hour. In the case of an
amended forecast, or a forecast which is
corrected or delayed, the valid period may be
for less than 24 hours. Where an airport or
terminal operates on a part-time basis (less
than 24 hours/day), the TAF's issued for those
locations will have the abbreviated statement
"NIL AMD SKED AFT (closing time) Z" added to
the end of the forecasts. For the TAF's issued
while these locations are closed, the word
"NIL" will appear in place of the forecast
text. A delayed (RTD) forecast will then be
issued for these locations after two complete
observations are received.
5. Forecast
Meteorological Conditions.
This is the body
of the TAF. The basic format is:
WIND/VISIBILITY/WEATHER/SKY CONDITION/
OPTIONAL DATA (WIND SHEAR)
The wind,
visibility, and sky condition elements are
always included in the initial time group of
the forecast. Weather is included only if
significant to aviation. If a significant,
lasting change in any of the elements is
expected during the valid period, a new time
period with the changes is included. It should
be noted that with the exception of a "FM"
group the new time period will include only
those elements which are expected to change,
i.e., if a lowering of the visibility is
expected but the wind is expected to remain
the same, the new time period reflecting the
lower visibility would not include a forecast
wind. The forecast wind would remain the same
as in the previous time period.
Any temporary
conditions expected during a specific time
period are included with that time period. The
following describes the elements in the above
format.
(a)
Wind.
This five (or
six) digit group includes the expected wind
direction (first 3 digits) and speed (last 2
digits or 3 digits if 100 knots or greater).
The contraction "KT" follows to denote the
units of wind speed. Wind gusts are noted by
the letter "G" appended to the wind speed
followed by the highest expected gust.
A variable wind
direction is noted by "VRB" where the three
digit direction usually appears. A calm wind
(3 knots or less) is forecast as "00000KT."
EXAMPLE-
18010KT wind one eight zero at one zero
(wind is blowing from 180).
35012G20KT wind three five zero at one two
gust two zero.
(b)
Visibility.
The expected
prevailing visibility up to and including 6
miles is forecast in statute miles,
including fractions of miles, followed by
"SM" to note the units of measure. Expected
visibilities greater than 6 miles are
forecast as P6SM (plus six statute miles).
EXAMPLE-
1/2SM - visibility
one-half
4SM - visibility four
P6SM - visibility more than six
(c)
Weather Phenomena.
The expected
weather phenomena is coded in TAF reports
using the same format, qualifiers, and
phenomena contractions as METAR reports
(except UP).
Obscurations to
vision will be forecast whenever the
prevailing visibility is forecast to be 6
statute miles or less.
If no
significant weather is expected to occur
during a specific time period in the
forecast, the weather phenomena group is
omitted for that time period. If, after a
time period in which significant weather
phenomena has been forecast, a change to a
forecast of no significant weather phenomena
occurs, the contraction NSW (No Significant
Weather) will appear as the weather group in
the new time period. (NSW is included only
in BECMG or TEMPO groups).
NOTE-
It is very important that pilots understand
that NSW only refers to weather
phenomena, i.e., rain, snow, drizzle, etc.
Omitted conditions, such as sky conditions,
visibility, winds, etc., are carried over
from the previous time group.
(d) Sky
Condition.
TAF sky
condition forecasts use the METAR format
described in the METAR section. Cumulonimbus
clouds (CB) are the only cloud type forecast
in TAF's.
When clear
skies are forecast, the contraction "SKC"
will always be used. The contraction "CLR"
is never used in the TAF.
When the sky is
obscured due to a surface-based phenomenon,
vertical visibility (VV) into the
obscuration is forecast. The format for
vertical visibility is "VV" followed by a
three-digit height in hundreds of feet.
NOTE-
As in METAR, ceiling layers are not
designated in the TAF code. For aviation
purposes, the ceiling is the lowest broken
or overcast layer or vertical visibility
into a complete obscuration.
SKC
"sky clear"
SCT005 BKN025CB "five hundred
scattered, ceiling two thousand five
hundred broken cumulonimbus clouds"
VV008 "indefinite ceiling eight
hundred"
(e)
Optional Data (Wind Shear).
Wind shear is
the forecast of nonconvective low level
winds (up to 2,000 feet). The forecast
includes the letters "WS" followed by the
height of the wind shear, the wind direction
and wind speed at the indicated height and
the ending letters "KT" (knots). Height is
given in hundreds of feet (AGL) up to and
including 2,000 feet. Wind shear is encoded
with the contraction "WS," followed by a
three-digit height, slant character "/," and
winds at the height indicated in the same
format as surface winds. The wind shear
element is omitted if not expected to occur.
WS010/18040KT -
"LOW LEVEL WIND SHEAR AT ONE THOUSAND, WIND
ONE EIGHT ZERO AT FOUR ZERO"
d. Probability
Forecast.
The probability or
chance of thunderstorms or other precipitation
events occurring, along with associated weather
conditions (wind, visibility, and sky
conditions).
The PROB30 group is used when the occurrence of
thunderstorms or precipitation is 30-39% and the
PROB40 group is used when the occurrence of
thunderstorms or precipitation is 40-49%. This
is followed by a four-digit group giving the
beginning hour and ending hour of the time
period during which the thunderstorms or
precipitation are expected.
NOTE-
Neither PROB30 nor PROB40 will be shown during
the first six hours of a forecast.
EXAMPLE-
PROB40 2102 1/2SM +TSRA
"chance between 2100Z and 0200Z of visibility
one-half statute mile in thunderstorms and heavy
rain."
PROB30 1014 1SM RASN "chance between 1000Z and
1400Z of visibility one statute mile in mixed
rain and snow."
e. Forecast Change
Indicators.
The following
change indicators are used when either a rapid,
gradual, or temporary change is expected in some
or all of the forecast meteorological
conditions. Each change indicator marks a time
group within the TAF report.
1.
From (FM) group.
The FM group is used when a rapid
change, usually occurring in less than one
hour, in prevailing conditions is expected.
Typically, a rapid change of prevailing
conditions to more or less a completely new
set of prevailing conditions is associated
with a synoptic feature passing through the
terminal area (cold or warm frontal passage).
Appended to the "FM" indicator is the
four-digit hour and minute the change is
expected to begin and continues until the next
change group or until the end of the current
forecast.
A "FM" group will
mark the beginning of a new line in a TAF
report (indented 5 spaces). Each "FM" group
contains all the required elements-wind,
visibility, weather, and sky condition.
Weather will be omitted in "FM" groups when it
is not significant to aviation. FM groups will
not include the contraction NSW.
EXAMPLE-
FM0100 14010KT P6SM SKC - "after 0100Z, wind
one four zero at one zero, visibility more
than six, sky clear."
2.
Becoming (BECMG)
group. The BECMG group is used when a
gradual change in conditions is expected
over a longer time period, usually two hours.
The time period when the change is expected is
a four-digit group with the beginning hour and
ending hour of the change period which follows
the BECMG indicator. The gradual change will
occur at an unspecified time within this time
period. Only the changing forecast
meteorological conditions are included in
BECMG groups. The omitted conditions are
carried over from the previous time group.
EXAMPLE-
OVC012 BECMG 1416 BKN020 - "ceiling one
thousand two hundred overcast. Then a gradual
change to ceiling two thousand broken between
1400Z and 1600Z."
3.
Temporary (TEMPO)
group. The TEMPO group is used for any
conditions in wind, visibility, weather, or
sky condition which are expected to last for
generally less than an hour at a time (occasional),
and are expected to occur during less than
half the time period. The TEMPO indicator is
followed by a four-digit group giving the
beginning hour and ending hour of the time
period during which the temporary conditions
are expected. Only the changing forecast
meteorological conditions are included in
TEMPO groups. The omitted conditions are
carried over from the previous time group.
EXAMPLE-
1.
SCT030 TEMPO 1923 BKN030 - "three
thousand scattered with occasional ceilings
three thousand broken between 1900Z and
2300Z."
2. 4SM HZ TEMPO 0006 2SM BR HZ -
"visibility four in haze with occasional
visibility two in mist and haze between 0000Z
and 0600Z."
|
|
|